The data modeling tools are used to define virtual semantic data models to instruct the tools how to query the database. Unlike the Data Flow, which is used to construct a database and schema, the configurations set in the Data Model are executed at runtime.
The data modeling tools consist of four main panels: Configuration, Tables, Columns, and Hierarchy. Each panel exposes a ribbon that provides access to a range of functions for that panel.
- Click here to learn about the Data Model ribbons.
Configuration
The Configuration panel shows basic information about the data model and the ETL. You can see and edit model metadata, like the model name, description, and default measure.
You can also see information about the ETL, including the Data Flow name and the destination database.
Lastly, you'll see a summary showing the number of tables, columns, and measures in the new data model.
- Click here to learn more about the configuration panel.
Tables
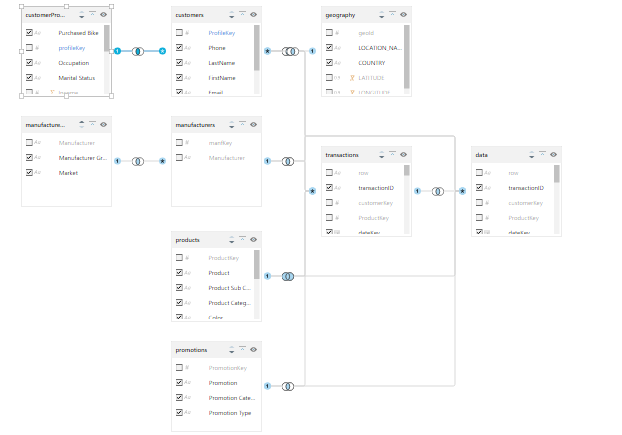
The Tables panel displays a graphical representation of the model's tables and the relationships between the tables. Each table is represented as a tile widget, which can be moved, collapse and expanded. Each table widget lists all the columns within that table.
From the Tables panel, you can edit relationships, columns, and measures.
- Click here to learn more about the Tables panel.
Columns
Column visibility and metadata can be managed from both the Tables panel and the Columns panel. The Columns panel presents a tabular listing of tables and columns, as opposed to the graphical representation shown in the Tables panel. Whether you choose to manage column visibility and metadata from the Tables or Columns panel will largely depend on personal preference.
The Columns panel is also used to sort the model's Columns, which cannot be done from the Tables panel.
- Click here to learn more about the Columns panel.
Hierarchy
Hierarchies are tree-structures made up of multiple columns arranged into a hierarchical order, enabling end users to traverse multiple columns (levels) from one visualization.
Hierarchies are constructed from the Hierarchy panel, by adding the required columns from a table. The panel displays visible table in the model; each table can be expanded to view its columns.
A hierarchy is built by adding several columns from a single table, in the logical hierarchical order.
- Click here to learn more about the Hierarchy panel.
